The Critical Role of Aerodynamics: Insights from the NASA-BeVERLI Hill Experiment
Introduction

Aerodynamics is a cornerstone of aerospace engineering, directly influencing aircraft design, space exploration, and the overall performance and safety of vehicles. In this post, I will discuss the critical aerodynamic principles applied in an experiment I conducted and the valuable lessons I learned. This experiment was part of my Experimental Methods course during the Fall 2023 semester at Virginia Tech, featuring a range of experiments to deepen our understanding of aerospace engineering. Among these, the Stability Wind Tunnel experiment—part of the BeVERLI Hill Project, a NASA-sponsored initiative—captured my interest. This project provided me with a profound understanding of the complexities in this field, mainly through rigorous experimentation.
Summary of Experiment
Since drag is an essential factor for aerodynamic performance, analysis of pressure distribution and boundary layer is necessary to help predict the aerodynamic behavior of the body. With the importance of researching unsteady, turbulent flow and boundary layer separation over a three-dimensional smooth curved model that is one of the common challenges to analyze in the aerospace industry, a BeVERILI (Benchmark Validation Experiments for RANS/LES Investigations) Hill project has been started to provide further details of information and analysis about the data. The BeVERLI Hill project aimed to offer high-fidelity data to validate turbulence models used in Computational Fluid Dynamics (CFD).
RANS (Reynolds-Averaged Navier-Stokes) is a method that averages the Navier-Stokes equations over time to predict the mean flow behavior, modeling the effects of turbulence through turbulence models. Navier-Stokes Equations describe the motion of viscous fluid substances.
where:
- : fluid density
- : fluid velocity vector field
- : time
- : pressure
- : dynamic viscosity
- : gravitational acceleration
- : gradient operator
On the other hand, LES (Large Eddy Simulation) directly simulates the large-scale turbulent eddies while modeling only the smaller scales, offering more detailed and accurate flow predictions. The filtered governing equations for large eddy simulation (LES) represent the behavior of large-scale turbulent structures, while the effects of small-scale eddies are modeled.
where:
- : filtered velocity component in the i-th direction
- : filtered pressure
- : kinematic viscosity
- : subgrid-scale stress tensor

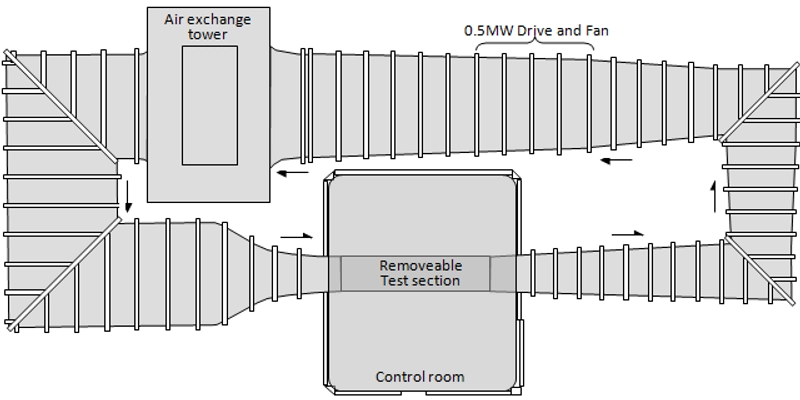
Figure 2: Schematic diagram showing the layout of the Virginia Tech Stability Wind Tunnel
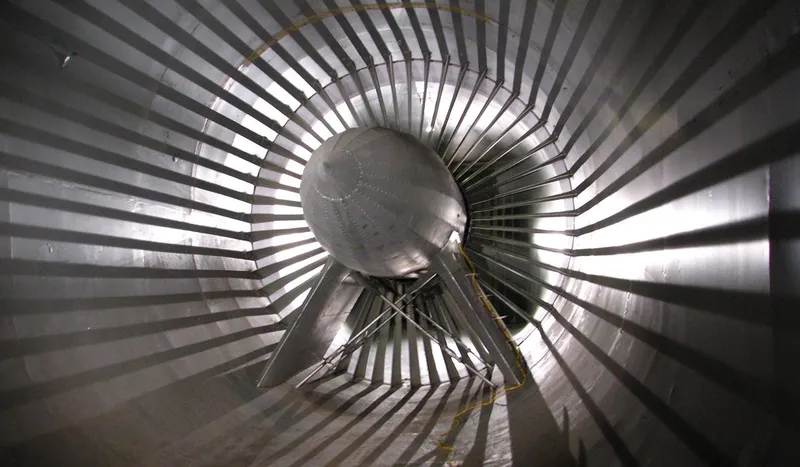
The Virginia Tech Stability Wind Tunnel is one of the largest university-operated wind tunnels in the United States, featuring a 1.85m × 1.85m test section. As a closed-circuit design, it continuously recirculates air through the tunnel, which offers several advantages: improved flow quality, reduced power requirements, better temperature control, and lower operational noise. With maximum speeds of 80 m/s (corresponding to a Reynolds number of 5,000,000 per meter), it provides exceptional flow quality for aerodynamic research. The tunnel’s unique design and capabilities make it particularly well-suited for detailed flow measurements and uncertainty analysis, essential for the BeVERLI Hill project’s objectives.
The project was originally started in February 2020, and the experiment I conducted was 6th test focusing on the wall pressure signature of a smooth bump at different Reynolds numbers of 250,000 and 650,000. These values were chosen to accurately simulate the transition from laminar to turbulent flow over the hill geometry under subsonic conditions.
As an undergraduate student, my goals of the experiment were
- To determine mean wall pressure distribution around wall mounted bump “BeVERLI hill” on each different Reynolds number on 250K and 650K respectively and compare the uncertainty of pressure coefficient.
- To validate unsteady wall pressure with power spectral density for each different Reynolds number with the calculation of mean and variance of 4 pressure port taps.
Given that turbulent boundary layers are inherently time-varying and complex, I employed Power Spectral Density (PSD) analysis to break down these fluctuating signals into their frequency components. This method allowed me to understand how energy is distributed across different frequencies—a critical insight for analyzing the unsteady forces acting on the hill model. To further ensure the reliability of my findings, I also conducted a thorough uncertainty analysis, which was essential for predicting the behavior of these turbulent flows with confidence.

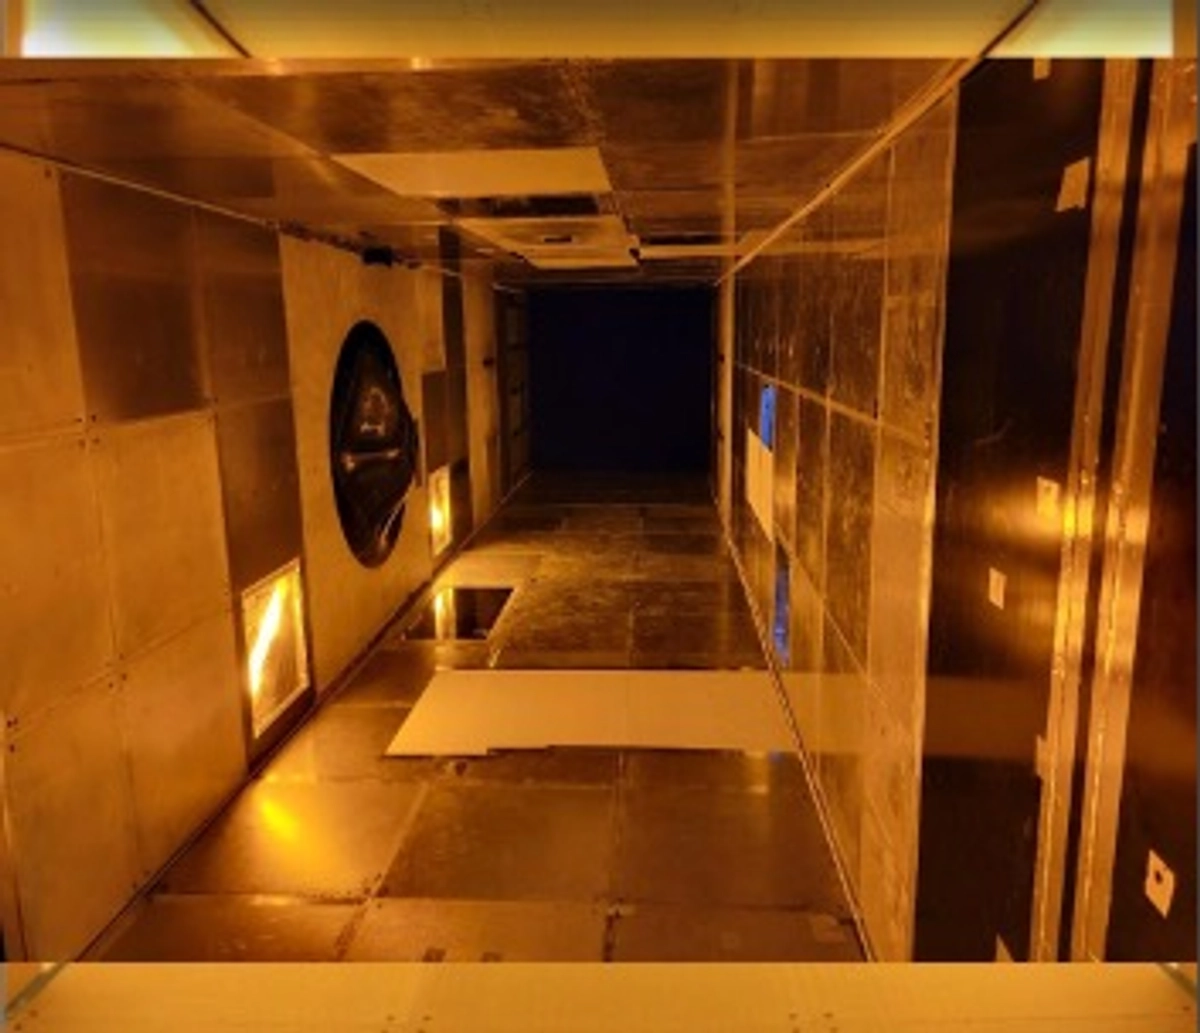
Figure 3: The test section of the wind tunnel, with the BeVERLI hill model mounted on the left wall. The model’s placement allows for precise measurement of wall pressure distributions and flow characteristics.
Key concepts for the experiment
Understanding laminar and turbulent flow is crucial in aerodynamics. With its chaotic eddies and vortices, turbulent flow significantly impacts drag, lift, and overall performance, making analysis more complex than laminar flow’s smooth, predictable nature. The Reynolds number is key in predicting the transition from laminar to turbulent flow, directly influencing drag forces.
Pressure coefficient
The compressible version of the pressure coefficient is given by the following equation:
Where:
- is the local static pressure,
- is the free-stream static pressure,
- is the specific heat ratio (typically 1.4 for air),
- is the free-stream Mach number.
Boundary Layer
The boundary layer is a thin region near an object’s surface where viscous forces dominate. It is crucial for determining drag, lift, and flow separation. Flow separation occurs when this layer detaches, increasing drag and causing potential instability.
Reynolds Number
The Reynolds number is a dimensionless quantity representing the ratio of inertial to viscous forces in a fluid flow:
where:
- is the fluid density,
- is the flow velocity,
- is the characteristic length (e.g., chord length of an airfoil),
- is the dynamic viscosity of the fluid.
Mach Number
The Mach number represents the ratio of flow velocity to the speed of sound in the fluid:
where:
- is the flow velocity,
- is the speed of sound in the fluid,
- is the specific heat ratio,
- is the gas constant, and
- is the absolute temperature.
Spectral analysis
Spectral analysis uses the Fourier Transform to convert a time-domain signal into its frequency components:
where:
- : Fourier transform of the signal
- : Original time-domain signal
- : Angular frequency
- : Time
- : Imaginary unit
For digital signals, the Discrete Fourier Transform (DFT) is used, which is defined as:
where:
- : k-th DFT output
- : n-th input sample
- : Number of samples
- : Index of the output in the frequency domain
- : Index of the input sample
The Power Spectral Density (PSD) can be estimated using the Welch method, which involves dividing the time-series data into overlapping segments, applying a window function to each segment, computing the DFT of each segment, and averaging the squared magnitudes. The Welch method is implemented in MATLAB, for example, using the pwelch function.
where:
- : Power Spectral Density
- : Number of samples
- : k-th DFT output
Uncertainty analysis
In uncertainty analysis, the total uncertainty in a result derived from measurements is calculated using the root sum square (RSS) method:
where:
- : Total uncertainty in the result
- : Result derived from measurements
- : Variables that R depends on
- : Uncertainties in variables a, b, etc.
- : Partial derivatives of R with respect to a, b, etc.
For a set of repeated measurements, the uncertainty of the mean is given by:
where:
- : Uncertainty of the mean
- : Standard deviation of the measurements
- : Number of measurements
The standard deviation itself is calculated as:
where:
- : i-th measurement
- : Mean of all measurements
- : Number of measurements
Personal Growth and Research Impact
This experiment significantly enhanced my research capabilities in several ways:
- Data Analysis Skills: Developed proficiency in processing and analyzing large datasets, particularly in spectral analysis and uncertainty quantification.
- Experimental Design: Gained hands-on experience in designing and conducting wind tunnel experiments, including calibration procedures and measurement techniques.
- Technical Communication: Improved ability to present complex aerodynamic concepts through clear documentation and visualization.
- Research Methodology: Learned to integrate theoretical knowledge with experimental data, developing a systematic approach to aerospace research.
The challenges encountered during this project, particularly in uncertainty analysis and spectral decomposition, have prepared me for more advanced research in aerodynamics and experimental fluid mechanics.
Conclusion
This experience with the BeVERLI Hill project has been transformative in my development as a researcher. The rigorous approach to uncertainty analysis has taught me the importance of statistical validation in experimental research. Working with advanced measurement techniques and data analysis methods has prepared me for future research challenges in experimental aerodynamics.
The project has also highlighted the critical role of collaborative research in advancing our understanding of complex flow phenomena. The integration of experimental data with computational methods (RANS/LES) demonstrates the modern approach to aerospace research, where multiple tools and perspectives are needed to solve complex problems.
I am also interested in exploring:
- Advanced measurement techniques for unsteady aerodynamics in rapid directional changes, particularly for drone applications
- Integration of machine learning with experimental data analysis
- Flow separation prediction and control methods for agile flight systems
This project has reinforced my commitment to contributing to the field of experimental aerodynamics and computational fluid dynamics through rigorous research methodologies.
References
- Virginia Tech Stability Wind Tunnel Article
- AOE Stability Wind Tunnel
- NASA Turbulence Modeling Resource